2026 Conferences we’ll be attending
PdMagic is looking forward to hitting the road in 2026 to attend conferences again. We’ll post the list soon.
As always, we will be attending the Traffic Records Forum which is in New Orleans this year.
Crash Magic Online™
Online Safety Management System
Crash Magic is a graphic display and data summary package designed for use in safety management systems for analysis of crash data. It includes detailed collision diagrams, data retrieval, crash summaries, statistical output, and user specified graphic displays. Crash Magic provides traffic safety specialists and law enforcement officials an exceptional tool for identifying crash patterns, high crash locations, and maintenance and operational concerns.
.uagb-ifb-image-content img { border: 1px solid black; }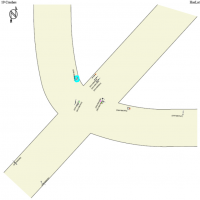
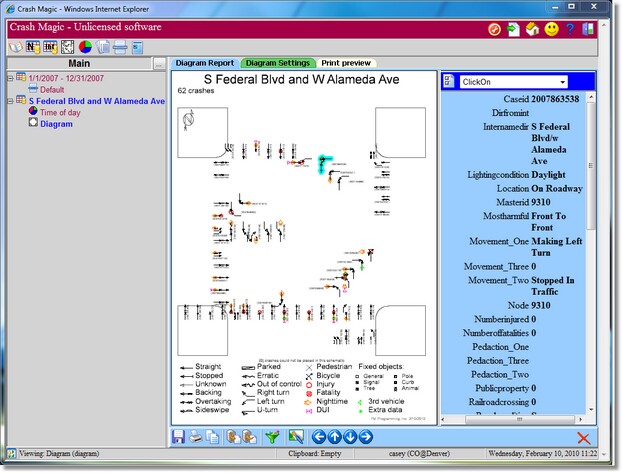
Superior Collision Diagrams
Pd’ Programming pioneered automated collision diagrams with Intersection Magic in the late 1980’s. We still focus on creating the best automated collision diagrams available.
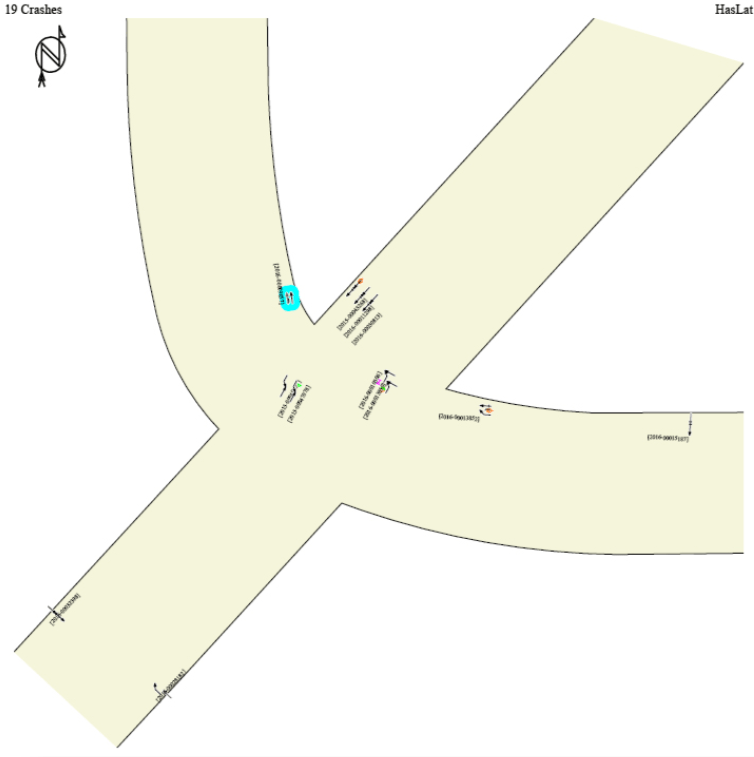
Since then, we’ve developed user customizable schematics, the best poor-data handling, highlighting, single-click reports, dynamic viewers, and true corridor diagrams for route milepost or link-node studies.
Starting in version 5, schematics are generated from your ArcGIS Server. That means that the road alignments directly match your street centerlines. Roads may curve, be on an angle, and corridors are properly supported.
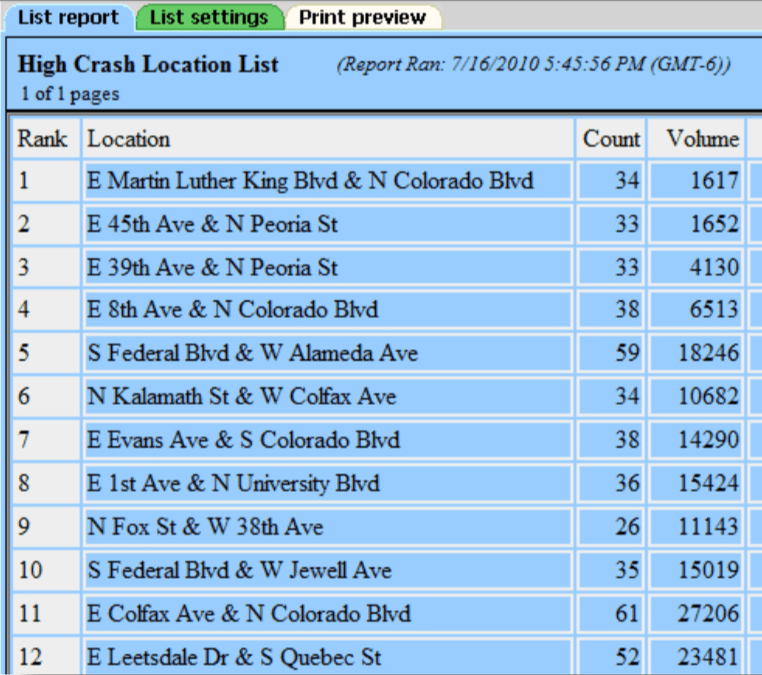
Hot Spot Locations
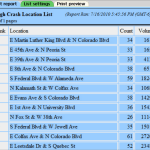
Hot spot locations can be calculated for intersections, nodes or a sliding window route milepost.
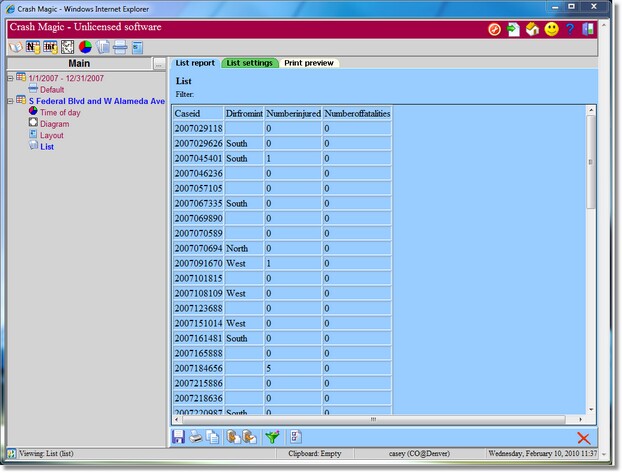
Hot spot lists include basic location and count information, as well as complex iterative calculations.
Lists may be printed, rendered as pins on a map or used to generate other reports such as diagrams, charts or listings.
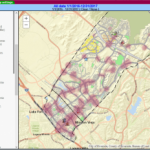
Pin and Heat Maps
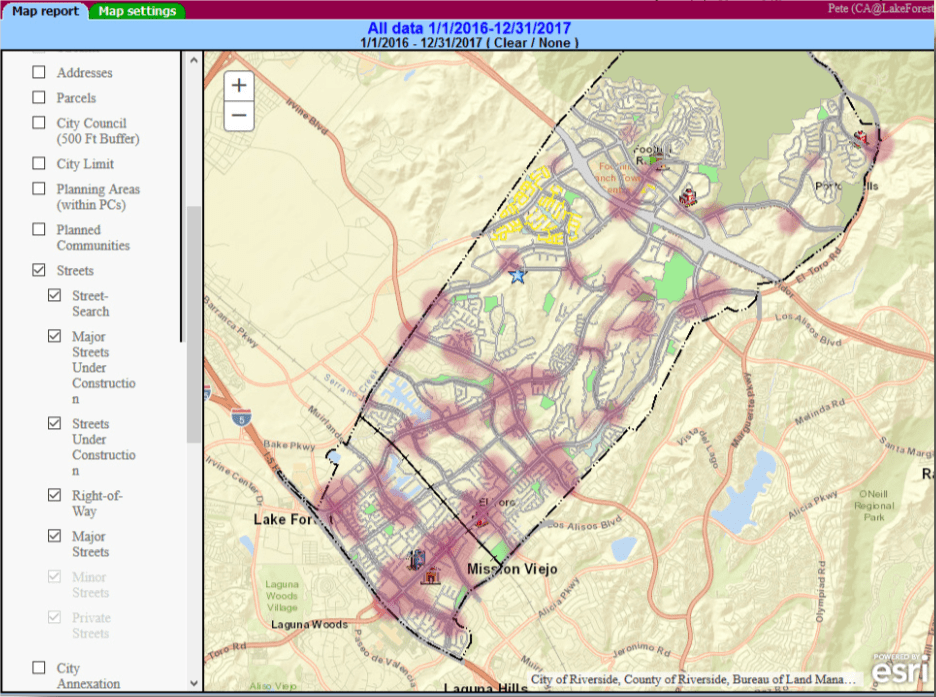
Data from any study can be viewed as
a pin map or heat map using ArcGISTM Server.
Heat maps are great for showing patterns in large areas, where individual pin maps show each crash and can reflect that crash’s individual attributes
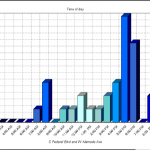
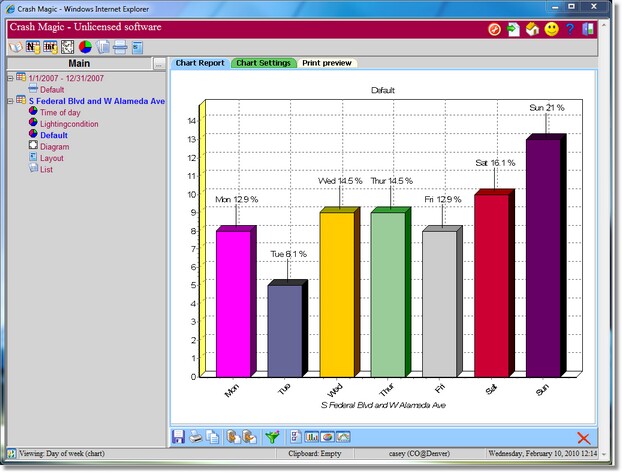
Summary Charts and Reporting
Charts can be created using any of the fields in the database. Charts can even be built from calculated fields. This feature allows for the creation of charts that reflect very complex combinations of fields.
As with all reports in Crash Magic, charts can be added to layouts alongside listings or diagrams for a complete picture of a situation.
Feature overview
System-wide aggregates
Location Specific
Interface